Sunday, June 20, 2010

Supercell formation observation

I have seen a number of supercell initiations this year and it occurred  to me that there is a distinction between a pure supercell initiation and a cluster of cells conglomerate supercell initiation. What do I mean?

Earlier this year in OK and way back in Nov 2005, dryline or near boundary initiation of supercells follow what appears to be a very linear low level reflectivity storm structure. From there these storms take time to evolve classic supercell structure at least in the low levels. (mental note: is this shear-instability dependent?)

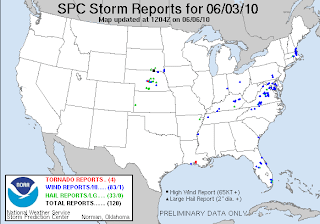
This other mode evolves differently. Multiple, close proximity storms initiate and seemingly "merge" or form a conglomerate. The pictures to the left illustrate this process. The southernmost storm in the cluster appears to dominate. The one tornado was reported around 2200 UTC.

It is odd, but it appears that "upscale" growth occurs via merging. The assumption I have been using without explicitly stating it, is that supercells appear to need to reach a critical size to become productive in terms of tornadoes. I wonder what the supercell size distribution is, but from what I have observed via radar, it can not be a wide distribution, and I wonder if the tornadic supercells fit neatly into a portion of the middle of that distribution. A certain size might be necessary to withstand shear, and may be dependent on the shear-instability relationship.

Another issue is how crazy it is to have all those storms to the north produce very little wind or hail reports while no more than 2 counties south you have a supercell. This is a weak example of that, but there are many scenarios where storms are in a similar environment, yet only a few random cells are rotating. Maybe this is size related, or more in line with Markowski and Richardson's work, in which locally the SRH is very different via different hodographs or storm motions or both.


Wednesday, June 16, 2010

Tornado aloft


I have never seen a "tornado aloft" description on a damage survey. Technically I guess this means that the tornado was intermittently in contact with the ground and the track was discernible. This would tend to cast some doubt on the definition of a tornado via wikipedia:

"A tornado is a violent, rotating column of air which is in contact with both the surface of the earth and a cumulonimbus cloud or, in rare cases, the base of a cumulus cloud."

Perhaps the inclusion of some sort of damage metric would be helpful to quantify "contact with the ground". Otherwise, technically this is mesocyclone damage. But this has scale implications as well because the damage pattern locally would be different.

Tuesday, June 15, 2010

Risk perspective

http://www.whartonmagazine.com/issues/815.php 

I saw this article about a game for understanding human behavior in the face of certain disaster. It was interesting to see what people thought especially in regard to hurricane risk.

The game is played such that you have a house, 20,000 in the bank earning 10 percent interest, and a guaranteed 3-5 earthquakes (either severe or mild)  before the game is finished. Let us assume that this is real life. I thought of two scenarios:
1. Let the house fail. Keep the money growing and just rebuild. (maximize cash to counter asset loss)
2. Fortify my house to a reasonable extent and increase the money. (minimize asset loss and cash loss)
3. Build and upgrade your house as much as possible. (maximize your asset)

The authors say that students who play this game opt for the money. This is a good risk from my perspective. The certainty is knowing that you will lose the house. So why invest in it when its a foregone conclusion you will suffer damage or total loss. This apparently makes you "lose" the game.

The "winning" idea is to rapidly upgrade your house to quickly deal with the certainty of a quake.

I happen to prefer the minimization technique though it is not clear at all if this strategy would pay off more than times than not.

The authors claim that the human mind fixates on short term gain rather than long term planning. The results appears counter-intuitive to me. The long term planning assigns the destruction as a certainty. It WILL happen. After all, what else would people do in a throw away economy? I understand why people would accept this as truth. This does not get at risk evaluation though. Risk is the lack of certainty on the potential destruction. Lack of Certainty. Potential destruction.

Once you include these factors things get more interesting. Rather than a severe or mild disaster, you need more of a distribution and a random one at that. Especially one that favors the shape of the true distribution (i.e. a long tail at the high end). Low probability of a strong quake. No guarantee of a quake. No potential threat assessment. Now do you protect your house minimally or increase your protection as time evolves given your interest rate?

Some argue that quakes and hurricanes are different. Hurricanes may have a few days warning and quakes happen without warning. Same to me given that interest accumulates on a different time scale.

Saturday, June 12, 2010

MCS a plenty

 The storm track has been active enough to produce a number of MCSs. The movie above gives a fair depiction of the number of MCSs in the last 14 days or so. In fact over NE the 14 day rainfall departure has a large area of 4 inches above normal with peaks in the 8 inch range. The area shrinks if you go out 30 days but the numbers hold up. Pretty impressive narrow rainfall corridor.


Below are the 1000 hPa Reanalysis 2 temperature, 925 hPa specfic humidity, 850 hPa v wind, and 300 hPa vector wind anomalies maps. The low level warm anomaly centered over CO-NM is accompanied to its northeast by a large anomaly in specific humidity near 4 g/kg coincident with a 3 m/s v wind anomaly. The upper level jet is also anomalously strong and lies just north of NE where most of the MCS activity has been.

 [As an aside, this El Nino pattern for the interior Pac NW where I live has seen some abundant rainfall as well. My locale is 1" above normal as of June 10 which is the equivalent in climatology of October 1st! ]

The El Nino pattern and thus some of the seasonal outlooks  I have seen have suggested that the western Great Plains would be anomalously high in precipitation AND slightly below normal in terms of temperature. The funny thing about El Nino patterns for the Plains: the precipitation signal is weak but present, but the temperature signal is very weak. This is a new area of research for me so my discussion here is lacking. However, this particular El Nino emerged rapidly from a La Nina state {and is currently forecast to go back into a La Nina state}. This last happened in 2006 but previously did not happen since 1976.

In terms of the severe weather season we have been having, statistically it appears dull. The tornado count is hovering near the 25th percentile despite an active early May and an intermittent late May and early June.

This year has seen an active May (not compared to 2008) which is somewhat unusual on this graph but I dont believe is unusual over the last 20 years.  I will have to check that out.

Sunday, June 6, 2010

Convection initiation

The event on the June 3rd was an interesting case of CI. Apologies in advance for the 1D depiction of the maps. I think I have decided I want a blog with a little more functionality ... like manipulating imagery more than just size, left or right...anyway.

This was a Vortex2 day where the shear was sufficient with plenty of moisture. The hodograph curvature was good enough and even made it into the outlook discussion:

However, only 1 tornado developed despite multiple storms developing. The storms appeared to stay small. The few that were able to grow larger became severe with 1 tornado produced.

What was more intriguing to me was the model forecasts that I had perused. The night before NSSL WRF run and NCARs WRF run from the night before and the morning of the event. I saved some imagery for this event for some crude verification.


Here are some (side by side apparently not possible ... a little help blogger?!) images of the NSSL vs NCAR 0000 UTC run:


Now here is the morning run from NCAR:

The discussion is as follows:
NSSL's run shows CI in western NE by 21 UTC from an area of low reflectivity which looks like noise. By 2300 UTC two areas stand out: southern SD and an area to the south in central NE. by 0100 there is a secondary band of broken convection that merges with the easternmost convection.

The NCAR run shows a large area of low reflectivity enter in western NE that gradually and then suddenly diminishes into an of small cells by 1900 UTC. By 2000 UTC these cells consolidate and CI commences in an arc. The arc of convection never intensifies except for the southernmost cell. But eventually the line falls apart and only two areas remain: southern NE and southeastern SD.

The morning run from NCAR had CI in western NE west of LBF by 1900 UTC, again from what appear to be remnants of a low reflectivity band. Again two areas develop, with the southern most cell in NE becoming the largest and breaking away southeastward. The cells in Northern NE and southern SD stay cellular through 0000 UTC.

Largely, the forecasts had a few things right. Convection would develop between 1900-2100 UTC, with two main areas of concern in NE and SD. The threats for supercells appear to be justified, given that models tend not to develop isolated cells in general, and the NCAR trend of not developing a squall line.

Water vapor imagery shows that CI occurred between 2200 and 2300 UTC in central NE first, followed by SD by 2315 UTC. The convection becomes washed out, by satellite perspective after 0600 UTC. 

I also show the OAX soundings for the two NCAR runs versus the observation. The 24 hr forecast  OAX sounding has evidence of anvil cloudiness and a stronger wind field aloft. Despite this the thermodynamic structure is similar enough in shape minus the ability to resolve the low level inversion. Much can be said of the 12 hour forecast for OAX. Though the inversion structure is different, the hodograph is much more comparable.

This leaves me with a few thoughts:
It would appear the kinematic fields can determine the location of CI despite similar evolution of the thermodynamic fields.

Why do the 24 hour forecasts show dissipation of the convection even though the cells form a line the NSSL run and an arc in the NCAR run? The formation of a squall line should build a cold pool that helps sustain convection.

It is interesting that if you directly compare the 00 vs 12 UTC runs one gets a sense of consistency or reliability. The differences might appear to be large, but if we don't take the NWP output too literally and add more uncertainty to the 00 UTC forecast I believe the models achieve a relative consistency and thus reliability. It would be very interesting to vary the boundary layer physics to see what variety of CI scenario's emerge in this context.

MCS development in CO-NM

An MCS developed tonight in CO-NM in an impressively warm environment aloft.

At first glance, it appears upslope flow penetrated deep into CO and Northern NM, underneath westerly flow. The terrain served to initiate convection. The upslope flow was responsible for transporting some moisture approaching 50 F to the region.


The impressively warm atmosphere apparently did not stop convection along the NM-AZ border either. As with a previous study (Bunkers et al. 2010), this highlights that warm temperatures aloft do not necessarily reflect convective inhibition. The low level moisture, lapse rate aloft, and forcing are important. So why the reliance on these warm temperatures? Forecasters rule of thumb, that when the mid level temps get warm, convection becomes increasingly unlikely. Most likely this "rule" was the recognition of a process of warming by subsidence such that a cap was present and forcing was either weak or non-existent.

So, now that my script is done running here are some stats at 500 hPa:
STATION   T    T90
ABQ       -4C    -6C
DDC       -4C    -6C
LBF        -5C    -7C
MAF       -3C    -5C
AMA      -4C    -6C
top          -7C    -7C
oun         -3C    -6C
fwd         -4C    -5C
epz          -4C    -5C
oax          -6C    -7C
drt           -4C     -4C
crp           -4C    -4 C
bro           -6C    -4C
dnr           -7C    -7C
sgf           -5C    -6C
lzk           -4C    -6C

These are the ones I have checked and all but 1, have exceeded the 90th percentile. It would be interesting to see how often all these stations have simultaneously hit the 90th percentile of warm Temperatures.