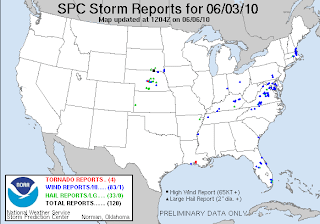
The event on the June 3rd was an interesting case of CI. Apologies in advance for the 1D depiction of the maps. I think I have decided I want a blog with a little more functionality ... like manipulating imagery more than just size, left or right...anyway.
This was a Vortex2 day where the shear was sufficient with plenty of moisture. The hodograph curvature was good enough and even made it into the outlook discussion:
However, only 1 tornado developed despite multiple storms developing. The storms appeared to stay small. The few that were able to grow larger became severe with 1 tornado produced.
What was more intriguing to me was the model forecasts that I had perused. The night before NSSL WRF run and NCARs WRF run from the night before and the morning of the event. I saved some imagery for this event for some crude verification.
Here are some (side by side apparently not possible ... a little help blogger?!) images of the NSSL vs NCAR 0000 UTC run:
Now here is the morning run from NCAR:
The discussion is as follows:
NSSL's run shows CI in western NE by 21 UTC from an area of low reflectivity which looks like noise. By 2300 UTC two areas stand out: southern SD and an area to the south in central NE. by 0100 there is a secondary band of broken convection that merges with the easternmost convection.
The NCAR run shows a large area of low reflectivity enter in western NE that gradually and then suddenly diminishes into an of small cells by 1900 UTC. By 2000 UTC these cells consolidate and CI commences in an arc. The arc of convection never intensifies except for the southernmost cell. But eventually the line falls apart and only two areas remain: southern NE and southeastern SD.
The morning run from NCAR had CI in western NE west of LBF by 1900 UTC, again from what appear to be remnants of a low reflectivity band. Again two areas develop, with the southern most cell in NE becoming the largest and breaking away southeastward. The cells in Northern NE and southern SD stay cellular through 0000 UTC.
Largely, the forecasts had a few things right. Convection would develop between 1900-2100 UTC, with two main areas of concern in NE and SD. The threats for supercells appear to be justified, given that models tend not to develop isolated cells in general, and the NCAR trend of not developing a squall line.
Water vapor imagery shows that CI occurred between 2200 and 2300 UTC in central NE first, followed by SD by 2315 UTC. The convection becomes washed out, by satellite perspective after 0600 UTC.
I also show the OAX soundings for the two NCAR runs versus the observation. The 24 hr forecast OAX sounding has evidence of anvil cloudiness and a stronger wind field aloft. Despite this the thermodynamic structure is similar enough in shape minus the ability to resolve the low level inversion. Much can be said of the 12 hour forecast for OAX. Though the inversion structure is different, the hodograph is much more comparable.
This leaves me with a few thoughts:
It would appear the kinematic fields can determine the location of CI despite similar evolution of the thermodynamic fields.
Why do the 24 hour forecasts show dissipation of the convection even though the cells form a line the NSSL run and an arc in the NCAR run? The formation of a squall line should build a cold pool that helps sustain convection.
It is interesting that if you directly compare the 00 vs 12 UTC runs one gets a sense of consistency or reliability. The differences might appear to be large, but if we don't take the NWP output too literally and add more uncertainty to the 00 UTC forecast I believe the models achieve a relative consistency and thus reliability. It would be very interesting to vary the boundary layer physics to see what variety of CI scenario's emerge in this context.


No comments:
Post a Comment